Constellate platform provides the content and tools you need together in one place, alongside a defined curriculum and robust tutorials, live classes taught by text analysis experts, and a community that scholars can connect to for inspiration and guidance. Constellate encourages scholars to:
· Leverage the platform's new feature to create 50,000 item datasets, view all the visualizations, and access the Constellate Lab
· Attend upcoming classes synchronously or asynchronously
· Join the Constellate email group for alerts about platform updates and new content have some documentation that might be particularly helpful in many ways, including:
Penn's subscription currently includes all the available collections:
Access to journals from JSTOR is restricted to current Penn faculty, staff and students.
Printing from the JSTOR database requires downloading a helper application called JPrint.
See the Dartmouth College Library's guide on Constellate for Tips and Tricks on building and analyzing datasets using Constellate.
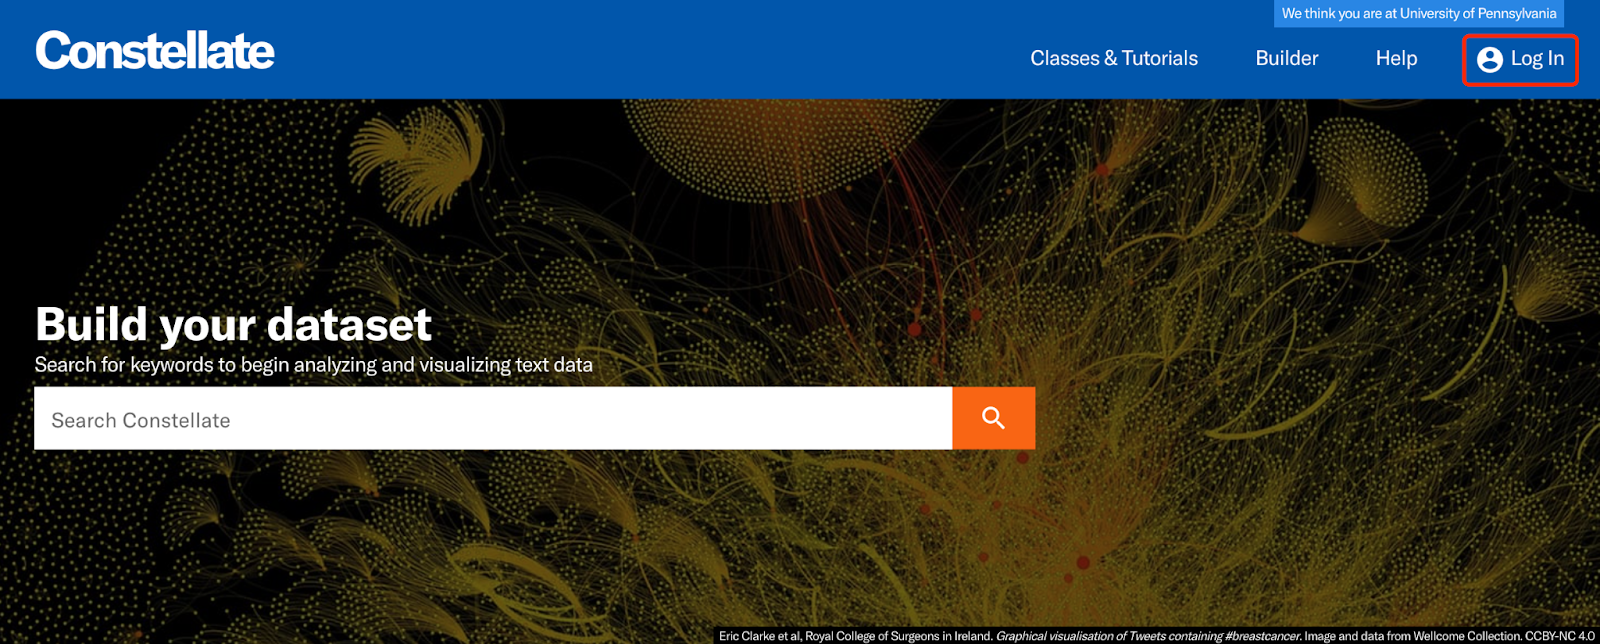
Go to Constellate (https://constellate.org/)
Select “Log In” in the top right corner
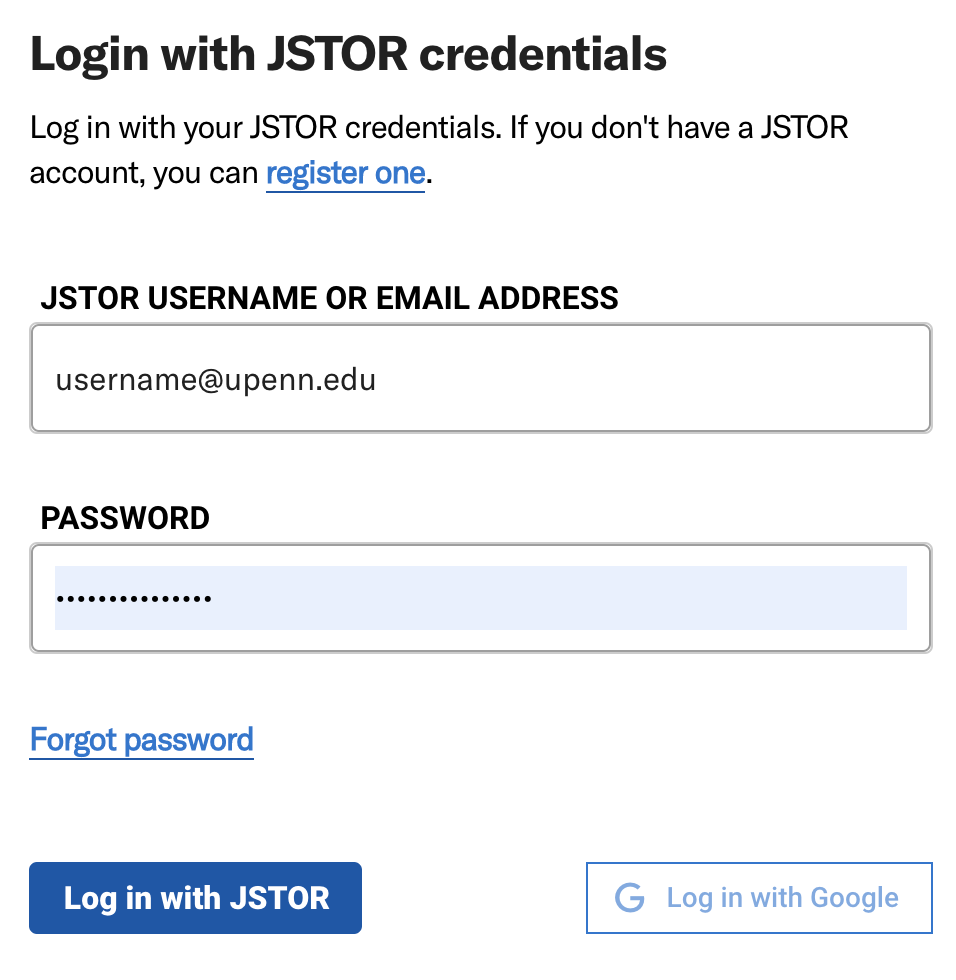
The Login window should pop up automatically. Now you are ready to log in by entering your email address and password!
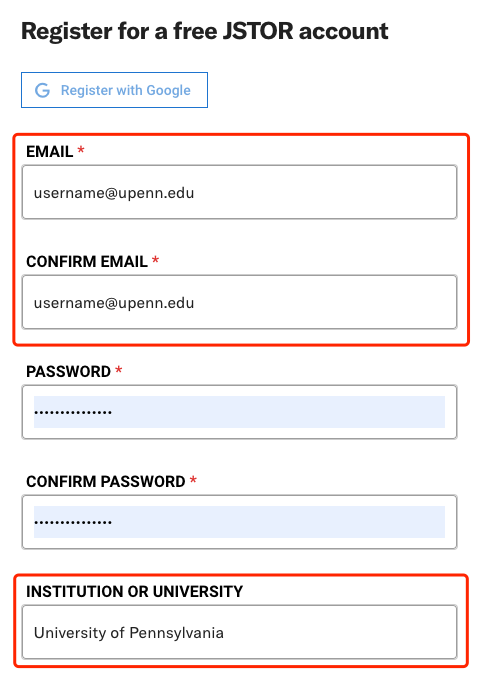
If you have a Google account from Upenn, then you may select “Register with Google”. Otherwise, you may enter your Upenn email address and enter “University of Pennsylvania” as your “Institution or University”. Finally, create your password, enter your role and area of study, read and accept Constellate’s terms & conditions, and click “Register”.
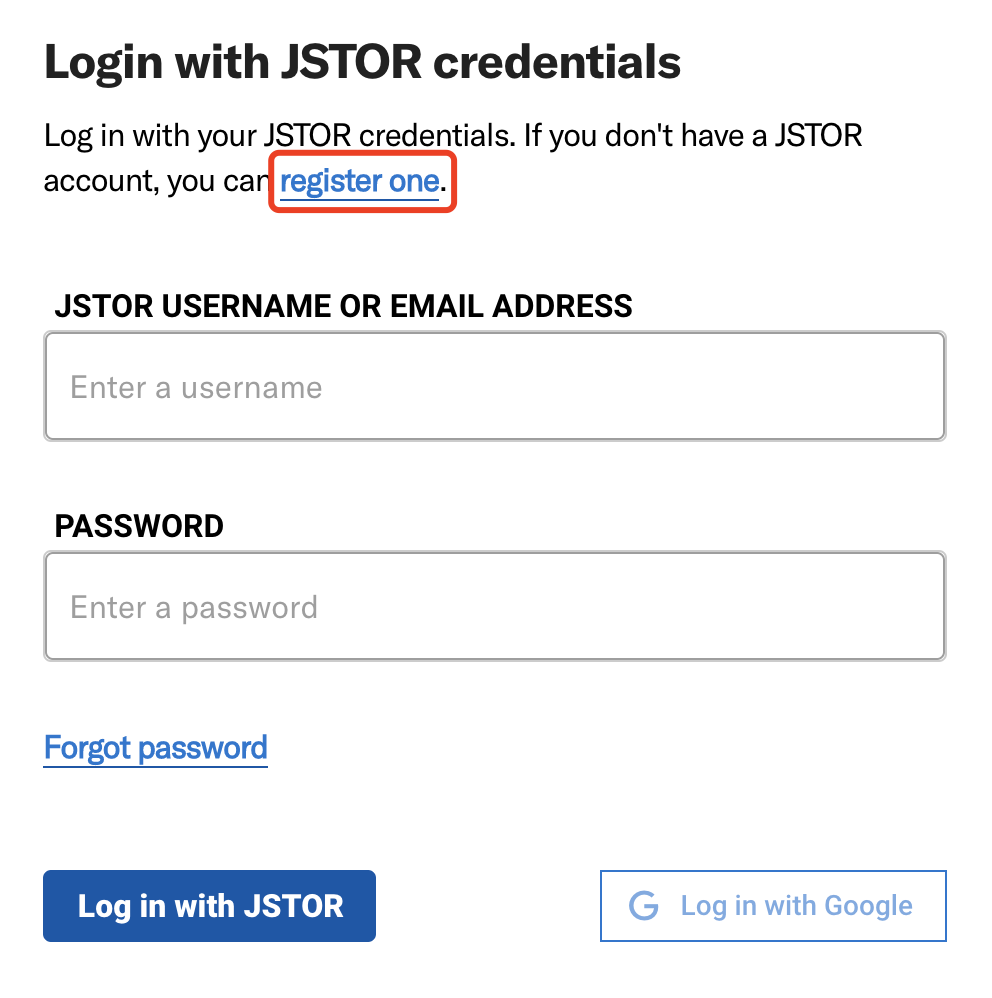
Click on “register one” if you do not have a Constellate account.
One of the most powerful features of Constellate is its dataset builder. We can start by exploring some of the pre-built datasets on Constellate.
By customizing the Keywords, Publication Title(s), and Publication Dates, Constellate will provide a series of exploratory visualizations of this periodical search. There is also an option to build datasets using specific providers, such as JSTOR, Portico, and other sources, under the “Provider” section. On the right side of the screen, there are:
A bar graph of the number of documents within selected the time period, showing the distribution of the documents across time.
Key phrases (such as unigrams, bigrams, or trigrams) diagram which contains n-grams extracted through a tokenization process, revealing the main themes and frequently used phrases in the text collection. You can also click on any word that appeared in the bubble plot to visualize the relative frequency of the word within the dataset.
Term frequency diagram where you can also enter a certain term to view frequency over time. When entering multiple terms, please separate each word with a comma. Additionally, we can also customize the y-axis by setting it either as the percentage of documents or total document counts.
There is a vertical ellipsis in the upper right corner for each visualization. A menu will pop up if you click on that icon, allowing you to save the graph, download the list as a comma-separated value file (.csv), or focus the visualization.
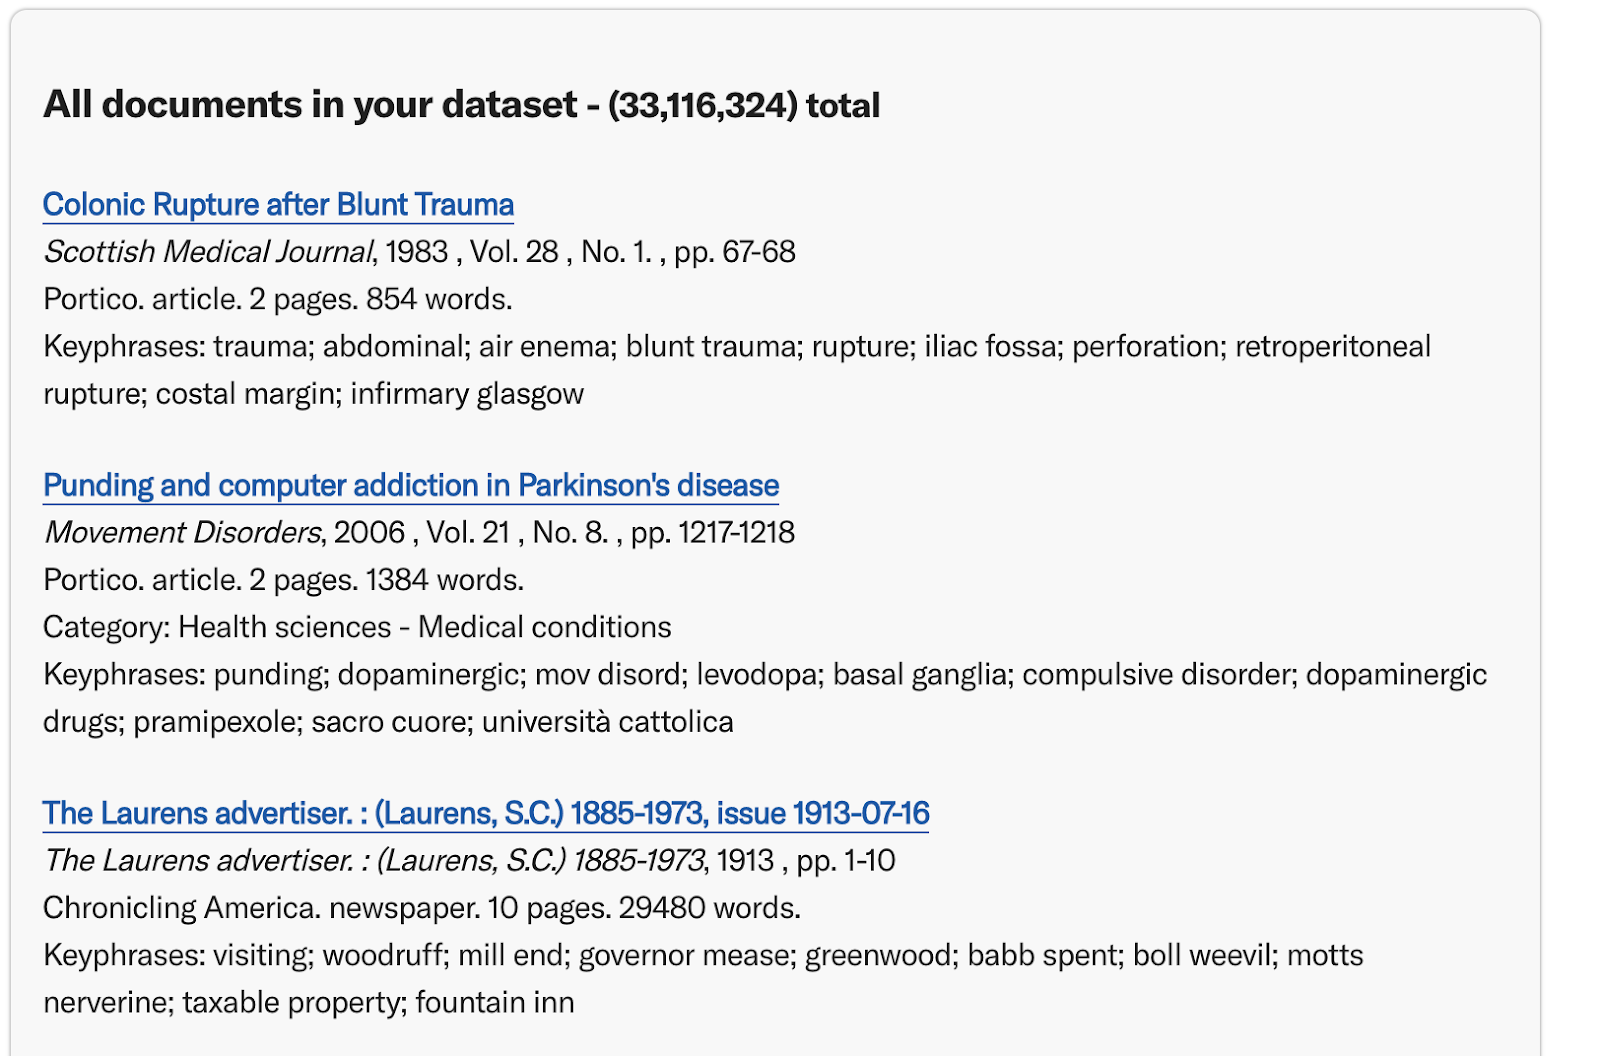
You can also explore both the results produced by your search as well as their visualizations. At the bottom of the dataset builder page, there is also a list of documents in your dataset.
The Constellate team has developed a set of classes that teaches programming in Python, text analysis, and the Constellate platform. The tutorials can be found in the Constellate Tutorials.